La Paz County, Arizona
A county in Arizona, ranked 14 of 15 by population.
CountyFIPS 04012
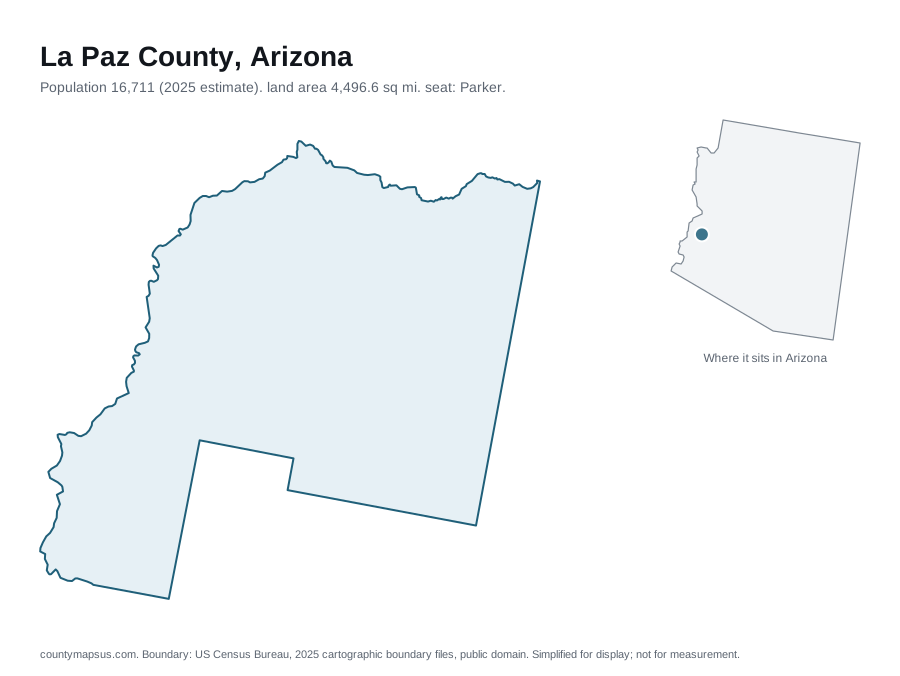
- Population
- 16,711
- +149 (+0.9%) since 2020
- Land area
- 4,497
- square miles. A further 0.3% of the total area is water
- Population density
- 3.7
- people per square mile, computed rather than published
- County seat
- Parker
- Seat of county government.
- Established
- 1983
- 42 years ago
- Largest city
- Parker town
- Population 3,394.
Sources: US Census Bureau, Population Estimates Program, Vintage 2025 Population Estimates, released 26 March 2026; US Census Bureau, Gazetteer Files, 2025 Gazetteer Files, released 10 September 2025; Wikidata (CC0), Wikidata. Retrieved 30 August 2026.
Satellite view
Aerial imagery of La Paz County with its boundary drawn on top. A map shows you the shape; this shows you what is inside it, and which side of the line a place falls on.
Where La Paz County ranks
Position among the 15 counties of Arizona, and among all 3,144 US counties and county-equivalents. Computed from the figures on this page.
| Measure | Value | In Arizona | Nationally |
|---|---|---|---|
| Population | 16,711 | 14th of 15 | 1,994th of 3,144 |
| Land area | 4,497 sq mi | 13th of 15 | 101st of 3,144 |
| Population density | 3.7 per sq mi | 15th of 15 | 2,851st of 3,144 |
| Median household income | $49,478 | 14th of 15 | 2,798th of 3,143 |
Full data for La Paz County
| Measure | Value | Source and vintage |
|---|---|---|
| Population | 16,711 | Vintage 2025 Population Estimates |
| Population in 2020 | 16,562 | Vintage 2025 Population Estimates |
| 2020 estimates base? | 16,554 | Vintage 2025 Population Estimates |
| Land area | 4,497 sq mi | 2025 Gazetteer Files |
| Water area | 14.1 sq mi | 2025 Gazetteer Files |
| Total area | 4,511 sq mi | 2025 Gazetteer Files |
| Population density? | 3.7 per sq mi | Computed: Vintage 2025 estimates divided by 2025 Gazetteer land area |
| Median household income | $49,478 | American Community Survey 2020-2024 5-Year Estimates |
| Median home value | $135,800 | American Community Survey 2020-2024 5-Year Estimates |
| Median age | 60.2 | American Community Survey 2020-2024 5-Year Estimates |
| Households | 8,959 | American Community Survey 2020-2024 5-Year Estimates |
| Housing units | 13,672 | American Community Survey 2020-2024 5-Year Estimates |
Sources: US Census Bureau, Population Estimates Program, Vintage 2025 Population Estimates, released 26 March 2026; US Census Bureau, Gazetteer Files, 2025 Gazetteer Files, released 10 September 2025; US Census Bureau, American Community Survey, American Community Survey 2020-2024 5-Year Estimates, released 29 January 2026. Population density is computed here, not published: it divides the Vintage 2025 population estimate by the 2025 Gazetteer land area, which are two different Census products. Retrieved 30 August 2026.
How the population changed
The Census Bureau publishes the components behind an estimate, not just the total. For the year to July 2025:
- Births minus deaths
- -216
- 160 births, 376 deaths
- Net migration
- +252
- More people moved in than moved out.
Source: US Census Bureau, Population Estimates Program, Vintage 2025 Population Estimates, released 26 March 2026. Retrieved 30 August 2026.
The 7 areas bordering La Paz County
Ordered by the length of the border actually shared, which the Census Bureau publishes in its county adjacency file and which no other county reference presents.
| Bordering area | State | Shared border | Population |
|---|---|---|---|
| Yuma County | Arizona | 104 mi | 224,449 |
| Mohave County | Arizona | 61 mi | 228,102 |
| Riverside County | California | 60 mi | 2,544,916 |
| Imperial County | California | 48 mi | 181,411 |
| Maricopa County | Arizona | 43 mi | 4,689,558 |
| San Bernardino County | California | 27 mi | 2,224,091 |
| Yavapai County | Arizona | 22 mi | 252,552 |
Source: US Census Bureau, County Adjacency File, 2025 County Adjacency File, released 15 September 2025. Retrieved 30 August 2026.
All 15 counties of Arizona
Open the interactive Arizona county map, or jump straight to any of them.
Data on this page last rebuilt 30 August 2026. How these figures are produced.